Real income of the population (RD) is calculated by adjusting the total income of citizens by the consumer price index.
As an indicator, real income characterizes the standard of living of the population and is an indicator taken into account when developing strategic programs for the development of the state.
Real incomes of the population and their essence
Unlike nominal incomes, real incomes provide an accurate picture of the well-being of citizens, since they show not the amount of income itself, but the number of goods and services that can be purchased. The size of the RD is influenced by the country's GDP, its redistribution, the price level and other factors.To calculate the RD, the nominal income of the population must be divided by the consumer price index. The dynamics of the indicator may be caused by changes in the total amount of income of citizens or prices for a specific period of time.
The RD indicator reflects purchasing power within a country or region, is calculated and used to develop socio-economic development programs.
RD sources
RD include income received by citizens, including from business activities.Sources of formation are receipts in cash or in kind:
- salaries;
- pensions, benefits and other material assistance;
- from renting out property;
- from investment activities;
- from business activities;
- insurance;
- received from subsidiary farming.
Ways to Promote
The growth of real income stimulates domestic consumer demand, which affects economic development. A person’s income depends on what goods he owns and how effectively he uses them. Real estate, land or financial resources can be sources of income.There is a direct relationship between the growth of real incomes of the population and the level of their well-being. The faster RDs grow, the faster the wealth of citizens and the amount of goods they can purchase increases. And vice versa - a fall in RD leads to a decrease in the level of well-being. Despite the fact that the real income of the population depends on the citizens themselves, their desire to earn money and improve their well-being, this indicator is largely influenced by the state. It creates conditions that can be favorable or unfavorable for income growth. This is not just about the impact on the price level.
The task of the state is to competently manage the distribution and direct resources to those areas that create material and intangible benefits and contribute to the growth of gross domestic product. This will create jobs, increase real incomes and the well-being of citizens.
1This article examines the question of the reasons for population differentiation in the Russian Federation. Basic concepts are presented that help to correctly understand the difference between the level of income and the differentiation of monetary income for a more accurate understanding of this issue and its correct analysis. Statistical data showing increased differentiation of the population in terms of average per capita cash income, both for the country as a whole and for federal districts, has been analyzed, and the main trends in the development of social differentiation of the population of the Russian Federation by sources of cash income have been identified. Using the coefficients of structural changes, the degrees of deviations in the compared population were found, and using the average growth coefficient and average absolute increase, a data forecast was made for 5 years in advance. Recommendations are given to solve this problem and maintain the positive trends found.
average per capita cash income
population differentiation
trend
federal district
social payments
coefficient
1. Ivanov Yu.N. Economic statistics: textbook. – M.: INFRA-M, 2013. – 668 p.
2. Markov S.A., Titov V.A. Improving methods for classifying regions according to indicators of the structure of investments in fixed capital (using the example of Central Russia) // Transport business of Russia. – 2008. – No. 2. – P. 61–63.
3. Martynov A.F., Titov V.A. Methodological approaches to managing innovative activity // Transport business of Russia. – 2006. – No. 12–4. – pp. 40–42.
4. Regions of Russia. Socio-economic indicators. 2015: P33. Stat. Sat. / Rosstat. – M., 2015. – 990 p.
5. Russian statistical yearbook. 2015: R77.Stat.sb./Rosstat. – M., 2015. – 717 p.
6. Official website “Consultant Plus”, [Electronic resource: http://www.consultant.ru/] (access date: 01/07/16).
7. Official website “Garant”, [Electronic resource: http://www.garant.ru/] (date of access: 01/07/16).
8. FSGS (Rosstat), [Electronic resource: http://www.gks.ru/] (access date: 01/07/16).
Currently, Russia is going through difficult times, caused, among other things, by the difficult political situation in the world: these are the sanctions imposed by the United States, the EU and their allies due to the Ukrainian crisis, the instability of the national currency due to a sharp drop in oil prices, the struggle with terrorism in Syria. However, this encourages the country to strengthen political views and determine vectors for further development, which is accompanied by significant transformations, mainly in the socio-economic sphere, such as increasing social differentiation of the population in terms of living standards, especially in terms of income, and the aggravation of the problem of poverty.
Therefore, in the current conditions, a study of the standard of living of the population helps to determine the causes of this problem, as well as to find a solution to reduce such a strong social gap and to strengthen the economic situation in the country. Changes in the standard of living of the population can be studied most comprehensively by analyzing the average per capita cash income, which allows us to clearly and objectively consider the problem of social inequality and identify the main trends in the standard of living of the population. Using methods such as the method of absolute, relative and average values; graphical and tabular methods; index method, analysis of time series, comparison, rating method, it is possible to identify in detail the reasons for the deterioration or improvement of the well-being of the population.
The standard of living of the population shows the degree of provision of the population with necessary material goods and services, the degree of satisfaction of reasonable, rational needs. The most important indicators of the standard of living of the population are the income of the population or resources in monetary and in kind terms, which are used to satisfy personal needs. And the degree of uneven distribution of material wealth between people is shown by the differentiation of monetary incomes of the population, which also helps to distinguish different layers and groups of the population depending on their level of income.
In general, in the Russian Federation, according to Rosstat, per capita cash income for the period since 2000 has increased 13 times and by the third quarter of 2015 amounted to 30,514.4 rubles. (according to preliminary data). On average, per capita cash income increased by 20% annually during the period under study. The most significant increase in the studied indicator was observed in the period 2000-2005. - more than 28% annually. Since 2007, a process of sharp decline in this indicator began over the next 4 years, which was due to the financial crisis that began in the United States, and a repeated decline was observed in 2013 and 2014. due to complex foreign policy factors.
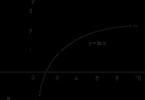
At the moment, by the 3rd quarter of 2015 there was a jump of 10%, which indicates an effective state policy in 2014 aimed at increasing not only this indicator, but also the birth rate in the Russian Federation as a whole, since these indicators are in constant communication. It is worth noting that over the past 8 years, average per capita cash income has increased 2.1 times and by the beginning of 2015 amounted to 27,766 rubles, growing by 11.8% annually (Fig. 1).
Rice. 1. Dynamics of average per capita monetary income of the population of the Russian Federation, rub.
All federal districts of the Russian Federation also experienced an increase in per capita cash income. The most noticeable growth was observed in the North Caucasus Federal District over the period 2008-2014. average per capita cash income increased by 113.8% (9,675.3 rubles) and by the beginning of 2015 amounted to 20,692 rubles, but the lowest growth rate was in the Ural region - 60.9% (18,951.9 rubles), by the beginning of 2015, the average per capita income was 30,494.1 rubles. In the Northwestern and Volga federal districts, cash income increased by more than 90%, which in absolute terms averaged 12,642.5 rubles, and in the Southern and Far Eastern districts there was an increase of more than 100%, which in absolute terms was 14 481 rub. From these data we can conclude that the growth rate of per capita monetary income is higher in those districts in which monetary incomes were at a lower level than in others. Thus, in the Russian Federation there is a tendency towards equalization of average per capita monetary income between districts (Fig. 2).
For a detailed consideration of this issue, we will analyze the monetary income of the population according to the sources of their receipt: wages; social payments; income from property; income from business activities; other income (income from sales of personal property, royalties, etc.) (Fig. 3).
From 2008 to 2014, the largest share was occupied by wages, which from 2010 to 2014 was within 65%. Social payments have an increasing trend, this is due to the active state policy to support socially vulnerable segments of the population; in 2008, the share of social payments was 13.2%, and by the beginning of 2015 - 18.0%.
By calculating the linear coefficient of structural changes for the period from 2008 to 2014, it can be obtained that during the period under review, compared to the base period, the share of individual sources of cash income of the population changed by 1.9%; and the average square coefficient of absolute structural changes is equal to 2.61%, which indicates a high level of differences in the structures of sources of cash income in 2008 and 2014. (Table 1).

Rice. 2. Average per capita cash income of the population of the Russian Federation by federal districts in 2008 and 2014.


Rice. 3. Structure of monetary income of the population of the Russian Federation, 2008-2014, %
Table 1
Calculation of the linear and quadratic coefficient of structural changes in monetary incomes of the population of the Russian Federation in 2008 and 2014, %
![]()
![]()
To identify the main trends and calculate the prospective value of average per capita monetary income from 2000 to 2014, the average growth rate and average absolute increase should be calculated:
![]()
The identified main trends in per capita monetary income, calculated by the three-tier moving average, mechanical and analytical equalization methods, are presented in Table. 2.

Rice. 4. Prospective value of average per capita monetary income for 2015-2020, calculated by extrapolation methods, thousand rubles.
table 2
Main trends in per capita monetary income in the Russian Federation
|
y(t) = 49747.55 - - 21992.65t |
||||||||
![]()
y(t) = 49747.55 - 21992.65t.
Thus, by 2020, the average per capita cash income could be 75,446.105 rubles, that is, 47,681.20597 rubles. more than in 2014
It is also worth noting that the average per capita cash income in the Russian Federation in 2014 was 27,764.9 rubles, and the most common per capita cash income, the modal indicator, was 11,326.2 rubles. Since it is 16438.7 rubles. below the average per capita income, then, consequently, most of the population has a low income, and there is a large difference between the incomes of the richest and poorest segments of the population. The average income of a Russian resident was 20,586.8 rubles, i.e. 50% have a feature value no greater than the median, and the other 50% have no less than the median. The cost of living was 8,050 rubles in 2014. per month, which is 3.5 times (or 19,704.9 rubles) less than the average per capita income. The decile coefficient of differentiation of monetary income in 2014 was 16.3, the Gini coefficient in 2008 was 0.421, and in 2014 it was 0.416, they are both still greater than 0.33, therefore, there is a significant degree of differentiation of the population. All of the above proves the presence of a high degree of differentiation of the population of the Russian Federation in terms of average per capita monetary income, but it is worth noting that there is a tendency to reduce this indicator.
To improve the current state of affairs and maintain this trend, greater government intervention is needed in regulating this problem through tax and program assistance to the poor, maintaining at the subsistence level those who are unable to provide a better life for themselves, although we should not forget that excessive government intervention in redistribution processes to equalize income can lead to a decrease in business activity in society and a drop in the efficiency of economic activity, as this “extinguishes” personal entrepreneurship. We also must not forget that income inequality is generated by the objective action of the market price mechanism, therefore the state social policy in a market economy should be a very flexible and subtle instrument, it is designed to contribute to social stabilization and mitigate social tension and at the same time not to undermine the incentives for entrepreneurship and highly efficient hired labor.
Bibliographic link
Titov V.A., Klimashina V.V. STATISTICAL ANALYSIS OF SOCIAL DIFFERENTIATION OF THE POPULATION OF THE RF BY THE SIZE OF AVERAGE PER CAPITA MONEY INCOME IN MODERN CONDITIONS // Fundamental Research. – 2016. – No. 3-1. – P. 207-211;URL: http://fundamental-research.ru/ru/article/view?id=40033 (access date: 09/18/2019). We bring to your attention magazines published by the publishing house "Academy of Natural Sciences"
The average salary in Russia in July was 39,355 rubles, which in real terms is 4.6% more than in July 2016. Such data is contained in the monthly report on the socio-economic situation of the country. In general, in January-July, the increase in average wages in real terms was 3% compared to the same period in 2016.
GDP is also growing, although not as dynamically as predicted - by only 1.5% in the first half of 2017 instead of the expected 1.7%.
However, real disposable cash incomes of the population of the Russian Federation continue to decline: in January-July 2017, as Rosstat notes, they decreased by 1.4% compared to the same period in 2016.
Real disposable cash income per capita is income minus mandatory payments, adjusted for inflation.
After real cash incomes of the population stabilized in June at the level of June 2016, in July they again showed negative dynamics, decreasing by 3.1% compared to the previous month and by 0.9% compared to July 2016.
Real incomes of the population have been declining for the fourth year in a row: in 2014 the decline was 0.7%, in 2015 - 3.2%, in 2016 incomes fell by 5.9% in real terms.
There is nothing surprising in such dynamics, notes Sergei, head of the center for analysis of social programs and risks at the Institute of Social Policy. GDP growth is more than moderate, there are no serious breakthroughs in the economy, wage growth does not exceed 3%, the expert notes.
Besides,
Against the backdrop of an albeit small increase in wages, pensions are declining in real terms, especially after a lump sum payment in January, which certainly contributes to the decline in the overall figure.
It should also be taken into account that in the current conditions, some Russians prefer not to pay taxes and go into the shadow sector, so some part of the income is not taken into account, despite the methods available to Rosstat, adds Smirnov.
According to Rosstat, in the first quarter, 13.4 million Russians, or 18.7% of the total employed, worked in the informal sector. Among men, 20.2% work informally, among women - 17.2%.
As Gazeta.Ru previously wrote, according to the results of the first quarter, the volume of shadow wages increased by 20%, to almost 2.4 trillion rubles.
According to a VTsIOM survey, for the third month in a row, the first place in the list of problematic topics for Russians is occupied by low wages and living standards in general - in July they were pointed out by 24% of respondents (against 18% in January 2017 and 14% in July 2016). One in five (21%) is concerned about the problematic state of the economy.
Another growth in the consumer lending market plays an important role in the decline in income levels: citizens, sensing a slight increase in salaries, hastened to take out loans, increasing their loan burden, according to an analyst at Alor Broker.
The share of overdue consumer loans is now officially about 21%, and unofficially it is 2 times more, he notes.
The population's debt to banks continues to grow. According to experts from the Institute of Social Analysis and Forecasting of the Russian Academy of National Economy and Public Administration, by July 1, 2017, the debt amounted to 11.2 trillion rubles. In 2014-2016, this figure averaged 10.5-10.7 trillion rubles.
For real incomes to grow, among other things, it is necessary that prices for goods and services grow at least at a slower pace than incomes. Now this is not happening, and there is no economic growth as such, says the head of the marketing agency Alekhine and Partners.
“So far we are only seeing a rebound from the lower point of the fall. It’s not worth talking about stable growth yet,
especially against the backdrop of new sanctions and a difficult geopolitical situation,” he said.
The tax burden, prices, housing and communal services tariffs, gasoline and other energy resources are growing, adds Korolev.
“A lot will depend on course ruble, how it will behave in early autumn: if the dollar begins to rise in price due to the actions of large corporations in the foreign exchange market, then prices for imported goods will rise further, and this will again lead to a decrease in real disposable income,” the analyst notes.
Doctor of Economic Sciences Sergei Smirnov does not expect sharp economic growth and real incomes of the population.
“There will be a gradual increase, breakthroughs like we saw in the 2000s. against the backdrop of rising oil, it won’t,” he notes. Then the chance to carry out real structural reforms was missed; now any transformation results in a reduction in the social burden of the state, adds Smirnov.
Korolev believes that the situation with low real incomes will persist as long as oil prices remain relatively low. “$50.7 per barrel of Brent is too little to fill the state budget, which means the state will continue to increase the tax burden,” the analyst notes.
The GDP produced in the national economy is subject to use in two directions: one part of it goes to reimburse the means of production spent in social production and for its further development, and the other goes into personal consumption of the country’s population, forming its income.
Income of the population- this is the amount of money and material benefits received over a certain period of time and intended to satisfy personal needs. Income comes to members of society in two ways.
According to the first, they are distributed depending on their participation in the national economy. This distribution is called horizontal, or functional, distribution of income when part of the national income is received by categories of the population actively participating in the market economy. They receive their share of income in the form of wages (workers), profits (entrepreneurs), salaries (employees), rent (land owners and homeowners), interest (owners of money capital).
In the second way, they go to that part of the population that, for reasons beyond its control, cannot participate in market economic activities. These categories of the population include pensioners, disabled people, the unemployed, and students. In this direction of income distribution, called vertical , the state always participates, regulating this process in accordance with established social norms. These categories of the population are provided with income in the form of payments from the state budget, which are called social transfers and are provided in the form of pensions, various benefits and scholarships.
Thus, main sources of income for the population are: wages, income from the use of property and from the results of business activities, social payments (transfer payments).
Main areas of use of income are: purchasing goods and paying for services, paying taxes and various contributions, accumulating savings in deposits and securities, purchasing currency.
Income of the population can exist in two forms - monetary and in kind. In cash workers are paid, income from business activities, pensions, scholarships, various benefits, income from property in the form of interest, dividends, rent, income from the sale of securities, etc. are paid.
In kind income comes to the population in the form of products from summer cottages and household plots, gifts of nature, as well as the results of performing all kinds of household work (home repairs, home furniture, manufacturing of household items).
Exists several types of income , the main ones being the following:
· labor income , which represent income received as a result of labor activity in the form of wages and business profit. Wage - this is the amount of money that compensates for the employee’s labor costs and ensures a certain level of satisfaction of his personal needs and the needs of his family members. There are nominal and real wages. Nominal wages - this is the amount of money received over a certain period of time after paying taxes and other obligatory payments. Real wage represents the quantity of goods and services that can be purchased for a nominal wage at a given price level;
· unearned income , representing income not related to work (interest on bank deposits, dividends on securities, lottery winnings, inheritance, donation, etc.);
· legal income , which include all types of income received from any type of economic activity that do not contradict the law and have been registered with government agencies;
· illegal (shadow) income , including income received from illegal economic activities hidden from society. This may include income from the drug business, from the sale of stolen property, smuggling, and income from “shadow” economic activities. Shadow income differs from legal income primarily in that its recipient does not pay taxes;
· nominal income - this is the amount of money received by individuals over a certain period of time (salaries, profits, interest on deposits, rent, transfer payments - unemployment benefits, pensions, scholarships, social security payments);
· disposable income – income that can be used for personal consumption and personal savings. It is formed when taxes and mandatory payments are paid from nominal income;
· real income, which is the amount of goods and services that can be purchased with disposable income over a certain time, taking into account changes in prices.
During the transition to a market economy, due to the rapid rise in prices, there is a need to bring the income of the population into line with the increasing cost of living. In order to maintain a certain achieved standard of living, the following methods are used:
· indexing , which represents an adjustment in household income in the event of an increase in prices for goods and services, leading to a decrease in living standards;
· income compensation , meaning reimbursement to the population of part of the additional costs caused by increased prices for groups of goods in mass demand;
· income adaptation , expressed in an increase in fixed income (pensions, scholarships, benefits) as the cost of living rises.
The amount of income and its distribution among population groups determines the standard of living. Standard of living - this is the provision of the population with the material and spiritual goods necessary for life, the degree of satisfaction of its needs. The standard of living is expressed using indicators such as the total volume of goods and services consumed, real income of the population, wages, working conditions, amount of free time, housing conditions, development of education, health care and culture, life expectancy, and the consumer basket.
In world practice, aggregated and general indicators of living standards are also used. UN experts assess the standard of living through Human Development Index (HDI) , which takes into account GDP per capita (or material security), average life expectancy, level of education and health care.
The most important indicator of living standards is consumer basket , which is a set of goods and services to meet the needs of the average family, consisting of two adults and two school-age children, and ensure a minimum standard of living. The consumer basket is formed according to the following main expense items:
· nutrition;
· clothes, underwear, shoes;
· sanitary, hygiene, medicine items;
· furniture, cultural, household and household items;
· housing and utilities;
· cultural and educational events and recreation;
· domestic services. transport and communications;
· taxes, mandatory payments and savings;
· other expenses.
The costs of purchasing a set of goods and services in the consumer basket are the basis minimum consumer budget .
Based on the minimum consumer budget, they determine minimum wage , which is a standard that determines the minimum acceptable level of remuneration for an employee by an employer for work performed for him.
If the total income of families or single citizens is at the level of 60% of the minimum consumer budget, then such a population lives in conditions subsistence level, or at the poverty line . The population that has cash income below the subsistence level is defined as poor.
Analysis of the main indicators of income and directions of their use allows us to understand the consumer capabilities of Russian families and predict the most likely changes in the standard of living in the conditions
recessions. We will begin our assessment of consumer opportunities with international comparisons that allow us to understand how poor or rich the Russian household sector is in comparison with other countries. To solve this problem, two sources of information can be used: IMF data on per capita GDP, assessed in accordance with purchasing power parity, and World Bank estimates on the distribution of world per capita monetary income of the population.
According to the IMF, in October 2014, per capita GDP in Russia amounted to 24,298 US dollars, which corresponded to 45th place in the country ranking for this indicator. World Bank information on the distribution of the Russian population according to 5% world groups of per capita monetary incomes, which in total constitute world incomes, indicates that 5% of the poorest Russian households are in the fourth decile group of the world wealth distribution, and 75% of Russians are - in the sixth decile group and above. Taken together, the comparison results indicate a predominantly middle position of Russian families on the world income scale. Consequently, in accordance with these estimates, mass consumption in our country already goes beyond minimal consumer needs, and the household sector, which has resources for development and chooses the directions for their use, becomes an important regulator of economic changes.
This conclusion is confirmed by official data from Rosstat on the dynamics of per capita cash income of the population in general and in the context of the main sources of cash income over the years of post-Soviet development (Figure 1). Despite the fact that during the analyzed period Russia went through years of significant decline in real incomes of citizens four times, in 2013 they were more than one and a half times higher than the level of the last Soviet years. Let's assess the scale of the impact of crises on citizens' incomes by determining their actual size in December of the corresponding year compared to the same period of the previous year. Economic and political changes in the early 90s of the last century led to a drop in real income in December 1992 to 44% of the level in December of the previous year. Fiscal and banking problems in 1995 provoked a decrease in this indicator to 78.9%, and the global economic crises of 1998 and 2008 lowered this indicator to 71.8% and 89.7%, respectively. It is important to emphasize that the decline in income always ended with one year, followed by a longer period of growth.
Since the bulletin is issued in conditions where there is a significant depreciation of the ruble and an almost double increase in inflation compared to the previous year (111.4% in 2014 versus 106.5% in 2013), it is especially important to carefully look at the dynamics of income in years of high inflation and volatility of the ruble exchange rate. In this case, we again turn to data for December.
Figure 1 -- Dynamics of GDP, cash income, wages and pensions, as a percentage of 1991 in comparable prices, December data
During the period under review, the economy and population learned to adapt to different economic policy models. The first of them is the hyperinflation of 1992, when the consumer price index according to December data amounted to 2,604% of the level of the previous year, which was accompanied, as already noted, by the largest decline in real incomes of the population (Figure 1). At the same time, the rate of decline in income was 2 times higher than the rate of decline in GDP. However, the very next year after this recession, a recovery began: hyperinflation persisted, but at a lower level (941%), and real incomes of the population increased by 28.6% compared to the previous year.
The events of 1994, when “Black Tuesday” happened on October 11 and there was a collapse of the ruble against the dollar (in one day the dollar exchange rate rose from 2,833 to 3,926 rubles per dollar), did not, however, lead to a reduction in real income of the population at the end of the year. This year they grew by 3.2%, and the consumer price index decreased by almost 3 times compared to last year. 1995 was the year of the policy of financial stabilization through the reduction of government spending, which was carried out using methods of administrative-volitional reduction or delay in financing items that significantly affected the income of the population. This inflation targeting policy led to a decline in the consumer price index from 320% in 1994 to 230%, but at the same time, as shown above, caused a fall in real incomes. Then, in 1997, inflation dropped to 112%, but Russians' incomes rose to 109.4% of the previous year's level.
In the default year of 1998, the consumer price index was 184%, and income compared to the previous year decreased by 28.2% and was below the 1992 level. But in 1999, the conditions for import substitution desired by the current authorities developed, and with annual inflation at 135.5%, incomes increased again - by 12%.
Following the described volatile period came seven years of high rates of economic growth and per capita real income of the population, which during this time increased 3 times, provided that GDP increased only 1.8 times. 2005 was a landmark year, when the pre-reform level of income was restored, and in 2007 it had already risen to 131.3% of the 1991 level.
In 2008, Russia faced another economic crisis, and then a fourth fall in real income was recorded (by 10.3%). The depreciation of the ruble led to an increase in inflation (according to December data, it amounted to 113.3% in 2008, and in 2007 - 111.9%), but this was not the only reason for the decline in income, since pensions and wages in the observed segment of the economy showed growth. An important determining factor was the reduction in nominal income from property and foreign currency sales over the year, which amounted to 17% and 28%, respectively. The dynamics of business income and wages in the unobserved segment of the economy, whose nominal growth rates lagged behind the inflation rate, contributed to the decline in income. In 2009, the crisis decline in income was fully compensated, and the growth trend, but at a lower rate, continued until recently. In 2013, real incomes of the population reached 158.7% of the pre-reform level, approximately the same scale describes changes in labor income, including the wage fund hidden from observation, and pensions and observed wages approached the 120% mark.
To analyze the situation in 2014, let us turn to the characteristics of the dynamics of monthly and quarterly levels of real income, wages and pensions, expressed as a percentage of the corresponding period of the previous year. At the time of completing the preparation of this bulletin, we had quarterly official data from Rosstat for only three quarters, and in monthly terms, data on household income, wages and pensions are presented for the period from January to November inclusive (Figures 2 and 3).

Figure 2 -- Quarterly dynamics of real income of the population, as a percentage of the corresponding period of the previous year, I-III quarters. 2013-2014
Compared to 2013, quarterly and monthly data on wages and pensions for 2014 clearly indicate a change in trend: there is a visible decrease in growth rates (Figures 2 and 3). Monthly revenue dynamics are volatile, and quarterly data indicates a significant decline in revenue in the first quarter, subsequent growth in the second and stagnation in the third. The discrepancy between income dynamics and changes in wages and pensions is due to a number of reasons, which we will consider in detail using monthly data. Here, first of all, it should be noted that the income of the population is sensitive to foreign exchange transactions: the cost of the currency sold by the population is included in income, while writing off money from currency cards is perceived as a sale of currency. In quiet years, surges in its sales are observed in January and May, when the effect of purchases using payment cards appears during foreign tourist trips for the long New Year and May holidays. Summer holidays abroad are distributed between June and September, so it does not have such a pronounced effect on the dynamics of the purchase and sale of currency, which is reflected in the income and expenses of the population. In 2014, an important factor in the decline or growth of household incomes was the fall in the exchange rate of the ruble against the dollar, which activates three factors that reduce the real incomes of citizens: (1) rising inflation, (2) a reduction in the volume of currency sales by the population and (3) increased activity from the point of view of from the point of view of converting part of business income into cash.

Figure 3 -- Monthly dynamics of real income of the population, as a percentage of the corresponding period of the previous year, January-November 2014.
Let us take a closer look at the four months characterized by the highest volatility of real incomes of the population relative to the same period of the previous year (March, May, June and November, see Figure 3). March saw the strongest drop in revenue (up to 92.7%), which outweighed the growth in other months of the quarter and brought the overall revenue level for the first quarter of 2014 down to 96.6% of the previous year's level. During this period, the dynamics of wages and pensions worked to increase income. The decline in income was facilitated, firstly, by the response of citizens to the significant weakening of the ruble against the dollar and euro: the refusal to sell foreign currency reduced income by approximately 2.5%, which was strengthened by the transfer of part of business revenue into cash currency. Secondly, the effect of the comparison base appeared, because in the previous year, this month saw the highest growth in real income (109.6%) since the 2008 crisis. The reason for this was the payment of dividends at the end of the year, which was maximum in 2013 and decreased significantly in 2014. Thirdly, the reduction in entrepreneurial activity in the observed and unobserved sectors of the economy played a role, in this case associated with the holding of the Olympic Games in Sochi at the beginning of the year. Finally, fourthly, the decline in income was affected by the compression of regional social payments, due to a shift in priorities towards wage growth in the public sector. The presence of the third and fourth factors is indicated by the dynamics of the income structure of the population. Thus, in the first quarter of 2014, we observed a noticeable decrease in the share of social transfers: from 18.6% in the first quarter of 2013 to 17% in the same period of 2014. Entrepreneurship, which intensified in January-February in connection with the Olympics, according to the results of the first quarter of 2014, slightly reduced its contribution to income (from 8.5% in 2013 to 8.3% in 2014), therefore, in March There was also a significant decline in business income.
In May of this year, when income reached its maximum growth compared to the corresponding period of the previous year and amounted to 106.0%, the main factor in its increase was the sale of foreign currency. On the one hand, pensions and wages grew at a minimal pace this month. At the same time, many citizens spent the long May holidays outside the country, but due to the March depreciation of the ruble, they previously transformed ruble cards into foreign currency ones, and therefore their purchases were reflected as sales of foreign currency. However, starting in July, postponed summer trips abroad and a general focus on prioritizing foreign currency savings minimized foreign currency sales.
The second point of income decline occurred in June (96.5%), when the effects of currency shocks were not observed, and wages and pensions were still growing, although at a lower rate compared to the beginning of the year. The indicators for this period are not affected by the base effect (in June 2013, real cash income of the population amounted to 102.1% of the corresponding period of the previous year), but changes in the income structure indicate a continuing decline in the importance of social benefits (their share fell from 19.1 % in the second quarter of 2013 to 18.7% in the second quarter of 2014) and business income (its contribution decreased from 8% in the second quarter of 2013 to 7.3% in the second quarter of 2014). Perhaps the factor of the decline in entrepreneurship became the main factor this month, and one of the reasons for this was the decline in entrepreneurial activity at the end of the quarter in accordance with the regular business cycle.
The third point was November, when revenues amounted to 95.3% of the previous year. This month, the average size of pensions in real terms fell below the previous year's level for the first time in a year, primarily due to high inflation rates. Data on real incomes and wages, which remained at 2013 levels in November, are based on preliminary estimates, but developments in the foreign exchange market suggest that the depreciation of the ruble was most likely the main reason for the decline in all components of income at the end of 2014 .
In general, the dynamics of household income observed during the year is similar to the threshold of an economic recession. It confirms the latest macroeconomic forecast of the Ministry of Economic Development of the Russian Federation, according to which, after two years of stagnation, the Russian economy is gradually creeping into recession. As a result, we expect a fall in real incomes of the population, which in this case may not be limited to just one year.
Considering models of adaptation to various political measures, we will separately focus on the main components of income, which include wages and pensions. The observed real wages of employees of large and medium-sized enterprises, which in official statistics acts as an indicator of accrued wages without taking into account hidden wages (Figure 1), is characterized by maximum volatility during periods of crisis and recovery. Its growth rate, as a rule, lags significantly behind the growth rate of income. During the economic recession of 1991-1998, agents of the Russian labor market followed the path of “holding on excess labor” by sharply reducing wages. The main mechanisms of “salary flexibility” were changes in the variable and - especially - the hidden part of wages, delays in their payment, as well as the absence of mandatory indexation of wages taking into account inflation. During the period of economic recovery of 1999-2007, there was a rapid (3.3 times) increase in real wages at large and medium-sized enterprises, however, the number of employees at these enterprises decreased by 3.2 million people. The same processes occurred during the crisis that started in 2008, but wages then began to grow at a lower rate, and the number of employees in enterprises of this type decreased even more rapidly (from 40.4 million people in November 2007 to 35 .6 million people in November 2013). In terms of wage growth during this period, the most successful year was 2012 when it increased from 111% to 115.2% in 1991 prices. However, already in 2013 we again observed a decrease in growth rates, and in 2014, as mentioned above, an analysis of the monthly dynamics of real wages, expressed as a percentage of the corresponding period of the previous year, shows a drop in its growth rate down to 98.8 % of the 2013 figure in August (Figure 3).
The increased flexibility of wages with a very stable level of employment in Russia contributed to the development of non-standard forms of remuneration, taking it beyond the limits of statistical observation. Research conducted by Rosstat on the quantitative measurement of hidden wages has made it possible to obtain price estimates of the scale of this phenomenon: on average, about 40% of the wage fund is hidden from statistical observation and is not involved in the formation of insurance and other contributions tied to wages. The specificity of informal labor income is that, on the one hand, they are more exposed to the risks of reduction in a crisis, and on the other hand, they more easily adapt to conditions of uncertainty. It is important to emphasize that informal income from employment creates serious problems for generating income for the joint part of the pension system. As a result, in 2012, with an average annual number of employees of 71.6 million people. Only 46.6 million people were payers of contributions to the Pension Fund of the Russian Federation. It is this phenomenon and the demographic forecast unfavorable for the pension system that maximizes the risks of pension instability. The curve of changes in real wages, estimated taking into account the hidden wage fund 3, follows the trends in the dynamics of per capita monetary income (Figure 1).
The dynamics of pensions are generally similar to the dynamics of wages at large and medium-sized enterprises. The difference in the situation is that the number of pensioners, in contrast to the number of employees at these enterprises, is steadily growing. For most of the 1990s, until the 1998 crisis, the government's social priority was the indexation of pensions. As a result, the financial situation of pensioners during this period was better in relative terms than that of other social groups. The situation changed after the 1998 crisis, when the growth of real wages for the first time began to outpace the growth of real pensions. This lag became especially dramatic after the start of the pension reform in 2002. Accordingly, during the period of economic growth in the 2000s, the well-being of families whose main source was pensions began to deteriorate relative to other groups - primarily those whose income primarily depends on wages. It was the failure of the pension system during this period that predetermined the model of its development during the crisis of 2008-2009, when the authorities took a number of measures aimed at significantly increasing pensions. The policy of focusing on accelerated growth of pensions yielded results: over the period from 2007 to 2013, real incomes increased by 1.2 times, observed real wages by 1.3 times, and real pensions by 1.7 times. The highest growth rates of real pensions in the entire post-Soviet history were observed in 2010 (by 34.8% compared to the previous year). In subsequent years, on average, pensions grew more slowly than wages, and already in November 2014, its real size turned out to be lower compared to the previous year (and a reversal of this trend is not expected in December).
The next important source of information about possible reactions to economic changes is the structure of the population's monetary income. In the last years of the Soviet period, it mainly corresponded to the standard of countries that have passed the stage of industrial development, in which the income of hired workers is the main source (80% or more) of family income. The fundamental difference was the absence of entrepreneurial income and income from property, the share of which in total income already in the first years of the formation of the Russian market economy rose to 20% and remained at this level until 2008 (Figure 4).
Access to these sources of cash income became the main positive effect of market reforms and ensured, despite a more than two-fold drop in real income, a certain loyalty of the population to the ongoing reforms. Entrepreneurial activity reached its maximum at the beginning of market reforms, when income from this type of activity began to account for 16% of all income of the population. At the moment we are seeing a twofold reduction in their share. The share of income from property reached its maximum in recent “fat years”, which was associated with the development of the stock market, but this growth driver is gradually weakening. Thus, during the period of the last crisis and the post-crisis economic slowdown, the share of new market sources of income was constantly declining, despite the growth of total real cash income. In 2013, it reached 13.5%, which indicates a tightening of opportunities for sustainable development of the household sector through diversification of income sources.

Figure 4 -- Dynamics of the structure of monetary income of the population, 1990-2013, in percent
The main source of cash income for the Russian population has been and remains the wages of hired workers. Relatively high growth rates of average wages contributed to an increase in its share in the structure of household income: from 63% in 2000 to 68% in 2007. Wages responded to the 2009 crisis by reducing their share, which was quickly offset by policy measures aimed at increasing the minimum wage and the level of wages in the public sector. At the same time, the accelerated growth of wages in the public sector was most clearly manifested in the structure of cash incomes of the population in 2013.
Among the changes in recent years, it is important to pay special attention to the increase in the share of social transfers in the structure of household income (up to 18-18.5% in 2010-2013) due to the sharp increase in pensions and benefits. Even in the best Soviet years (1985), the share of social transfers did not rise to this level. The increasing share of benefits and pensions is a reaction to high inequality, an attempt to reduce it through the redistribution of income through the system of social benefits. As a result of this policy, pension obligations have now reached the highest level in the entire history of the development of the pension system. It should be noted once again that this happened in conditions where at least a third of earnings do not participate in the formation of pension contributions.
Table 1 - Volume and structure of cash income of the population by source of income, 2013-2014.
|
monetary |
including in percentage: |
|||||
|
business income |
wages, including hidden wages |
social |
property income |
|||
Data for three quarters of 2014 (Table 1) indicate that the ongoing policy of increasing wages in the public sector increases the share of wages in household income, and the entrepreneurial activity of the population continues to decline. Social payments, with the exception of pensions, are gradually declining (Figure 4), which, as already noted, is due to the policies of regional authorities, which have shifted social priorities towards increasing wages in the public sector.
Thus, at present, the average per capita cash income of the population is more than one and a half times higher than the level of income security in the last years of the Soviet period. The growth of average pensions and wages lags behind the growth rate of income. This is mainly due to the dynamics of new sources of income, to which we include entrepreneurial income, income from property and labor income hidden from statistical observation. Since the second half of the 2000s, there has been a decrease in the share of income from property and business activities in the overall structure of income of the population, which is associated with the deterioration of institutional conditions for business development. The share of social transfers, on the contrary, is increasing and reflects the state’s attempts to curb the growth of inequality through the inclusion of redistribution mechanisms. Changes in recent months record a decline in the population's cash income, which is explained by rising inflation, a reduction in entrepreneurial activity and a fall in the growth rate of wages and pensions. In general, it can be noted that in the current economic downturn, households with a single source of income, which most often is either wages or a pension, are again in the most vulnerable position.